The end goal of any discounted cash flow valuation is to estimate the future cash flows which, once discounted at the present day, will determine the company’s intrinsic value.
Estimating the appropriate growth rate needed to project current cash flows into the future clearly plays a crucial part in every company valuation.
Growth is a function of how much a company reinvests and its capacity to generate a return on such investments.
As frequently encountered in financial literature, calculating growth (g) is intended as calculating the expected growth rate in earnings by multiplying the retention rate (b) – which measures what percentage of earnings has been retained in the company instead of being payout to the shareholders in the form of dividends or buybacks – and the return on equity (ROE) – which indicates the return generated by equity investments.
g = b * ROE
b = retained earnings / net income
ROE = net income / book value of equity t-1
Although financial literature mostly focuses on earnings growth derived from equity investments, there exists a different configuration of expected growth which considers the whole firm including both equity and debt investments.
In such a configuration, net operating profit replaces earnings, and the expected growth rate is obtained by multiplying the reinvestment rate – which measures the percentage of net operating profit reinvested in operating activities – by the return on invested capital (ROIC) – which indicates the return generated by both equity and debt investments.
g = reinvestment rate * ROIC
reinvestment rate = (adj. CapEx – amortization – change in WC) / net operating profit
ROIC = net operating profit / (book value of equityt-1 + book value of debtt-1 – cash & equivalentst-1)
However, there exist also another variant of this second configuration which isn’t based on the operating income – which for many companies is a negative value – but rather is based on total revenues – which by nature can’t be negative. The sales to invested capital ratio is used instead of the ROIC and the reinvestment rate is expressed as a percentage of revenues rather than as percentage of net operating profit.
g = reinvestment rate * sales to invested capital
reinvestment rate = (adj. CapEx – amortization – change in WC) / total revenues
sales to invested capital = total revenues / (book value of equityt-1 + book value of debtt-1 – cash & equivalentst-1)
The greatest benefit of opting for the firm configuration—especially using revenues—over the equity configuration lies in the fact that earnings can be easily manipulated by accounting principles and tend to fluctuate more from year to year, resulting in distorted expected growth rates. On the other hand, revenues are less prone to accounting miscalculations and tend to follow a smoother pattern in the long-term allowing for more accurate expected growth rates.
Before jumping in and calculating the expected revenue growth rate, one last important aspect needs to be clarified. We do not recommend using this approach with companies whose business model is highly influenced by the price of a commodity. For firms like gold mining companies, or oil refinery companies, it would be too simplistic to calculate the expected revenue growth rate on the sole basis of how much they have invested in the past, being their business model strongly related to the price of the underlying commodity.
However, the material and energy sectors are not the only ones whose performances correlate with the price of another asset. The financial sector and the real estate sector should also be treated as commodity companies. Interest rates are a key driver of overall performance in the financial sector, while the price of residential and commercial properties plays a similar role in the real estate sector.
To avoid skewing our research results, we have excluded the financial, energy, real estate, and materials sectors from my analysis. From now on, any data we present to you will exclude and not apply to these aforementioned sectors.
Forecast Industries Growth Rates
With that said, estimating a company’s expected growth rate is easier said than done. Many are the variables that can influence companies’ growth and more than often the expected growth rate we estimate at the beginning of the year does not coincide with the actual growth rate registered by the company at the end of the year.
Other than macroeconomic factors affecting the business in which a company operates, it’s important to remember that the company we are analysing is not the only player in the market. Each and every firm will face challenges from rival forces aiming to gain market shares and expand their operations.
Macroeconomic factors, like inflations and interest rates, as well as microeconomic factors, like the presence of a dominant player or the entrance of new competitors, will heavily influence the actual growth rate achieved by the company we are analysing.
A first step which helps mitigate such external influences is to calculate a median expected growth rate for a longer period rather than estimate the growth rate for the next year. By doing so we obtain a double benefit:
Firstly, if the time frame considered is sufficiently long, the short-term fluctuations caused by macroeconomic factors – like a period of rising interest rates followed by a period of declining ones – should even out.
Secondly, by using a longer period we allow the reinvestments made to actually generate positive returns.
Usually, a company’s investments take more than one year to generate a positive return, so it is plausible but likely improbable in the real world to assume that what was reinvested last year will generate a significant return the following year
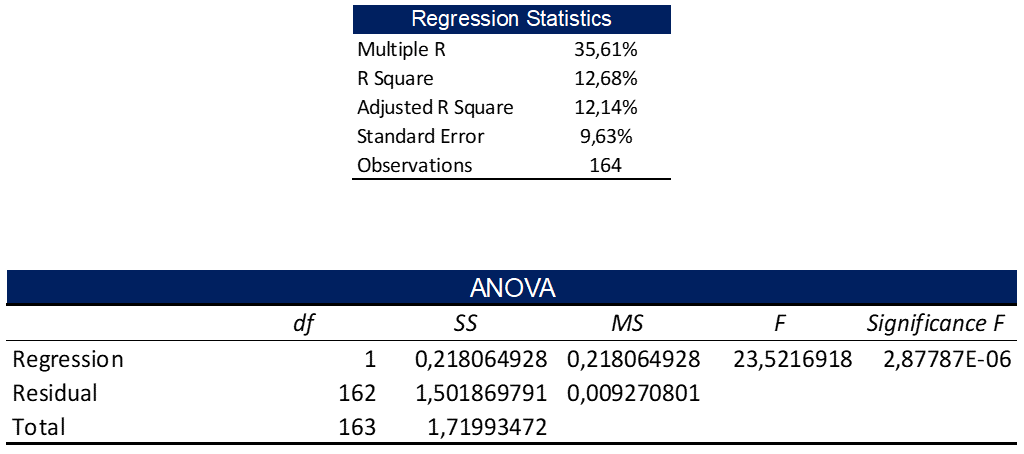
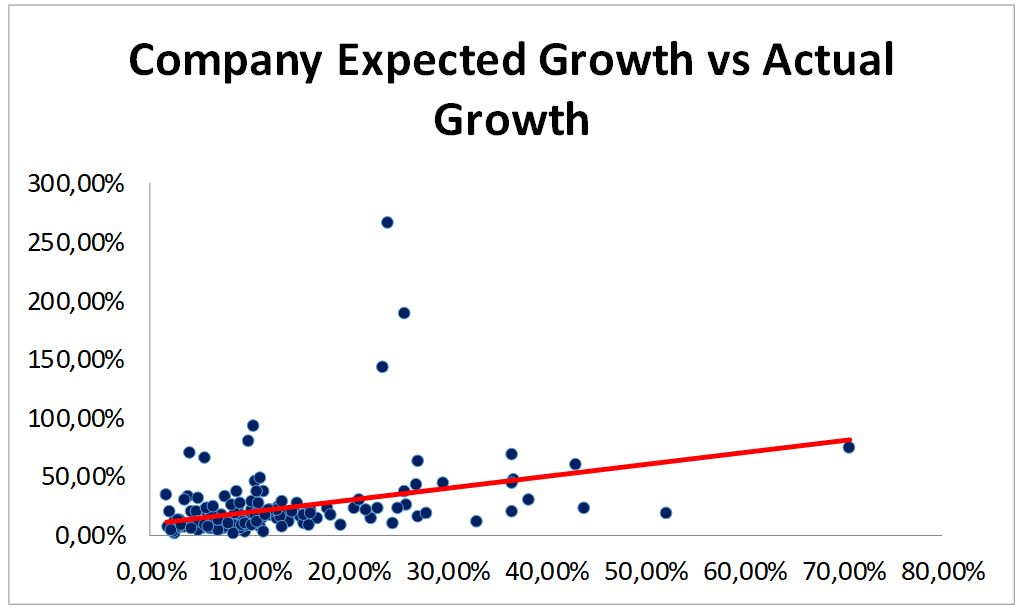
We took a sample of 164 companies – representing different sectors and markets – and calculated the firm’s expected growth rate for each year in the period 2011-2020 to then take the 10-year median value for each company. We then calculated the 10-year median actual revenue growth rate registered by those companies for the period 2012-2021 and compared the two values.


Despite the presence of a positive — statistically significant — correlation between the two values saying that it would be sufficient to use the 10-year median expected growth rate to estimate future revenues would be a bold statement. The R squared is positive but very low, and the standard error is a whopping 9.6%, meaning that an expected growth rate of 10% can fluctuate between 0.4% and 19.6%, quite a significant difference when trying to estimate future cash flows.
Companies by nature bring a lot of uncertainty and volatility to the table, as they are affected by numerous external factors that can positively or negatively influence their growth rates. Therefore, using just a median value is still not sufficient to provide a reliable estimation of growth.
The next step therefore is trying to eliminate the intrinsic uncertainty and volatility of single companies by looking at the bigger picture – the whole industry in which the company operates.
As said before, most investors forget the company they are analysing is not the only player in its industry – a feature only a handful of companies can boast of having – but rather is just one of the many actors playing the business game threatened by the ever-existing chance of new players entering the game and disrupting it.
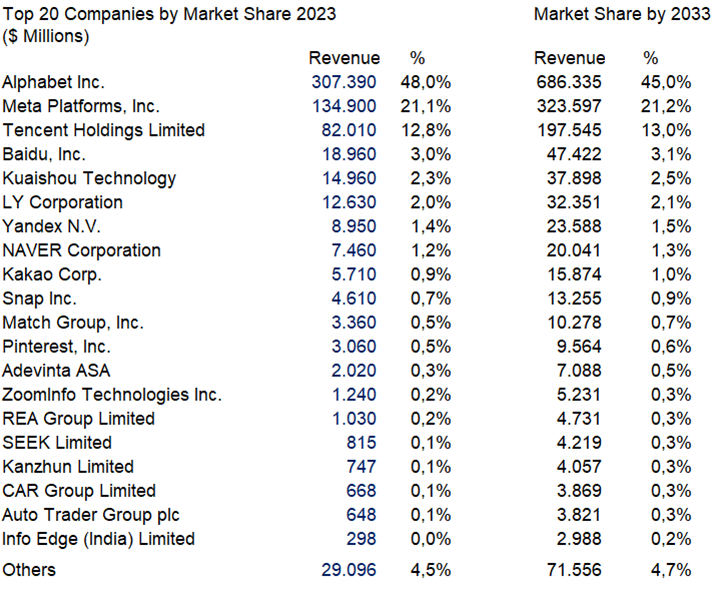
When valuing a company – before any sort of cash flow projection – a smart investor should always have clear in mind where the company will place among its competitors and what market share the firm and its direct rivals will likely achieve in the future.
Any industry, whether big or small, is nothing but a collective of companies, therefore, by aggregating the single values of each participant we can obtain industry-level data like the industry total revenues, the industry operating income, the industry total reinvestments, the industry ROIC, the industry revenues growth rate and so on and so forth.
Having such values, we can apply the same formula we have used so far to estimate growth and estimate the expected growth rate for the whole industry.
We collected relevant data for 5’563 companies – geographically distributed all around the globe – from 37 different industries and obtained industry-level data. Using the same approach as before we calculated the median expected growth rate for the period 2013-2022 as well as the median actual revenues growth rate for the period 2014-2023 for each industry and compared the two values.


Again, we obtained a positive – statistically significant – correlation between the two values but this time the reliability of the model is on a completely different level. The correlation between the values is a staggering 65% and the R squared significantly improved to a far more significant level. However, what is worth mentioning is the standard errors sitting at 2.5%, still not close to zero, but considerably more manageable than before.
Moving from a bottom-up approach to a top-down approach allows for the elimination of noise in the data and provides a far more reliable estimation of growth, which can be used in valuing companies
Forecast Companies Growth Rates
What we have obtained so far however, is the expected revenues growth rate for an entire industry, but our goal here is to being able to forecast the revenues of the company we are analysing. The second chapter of this story therefore, will focus on how to calculate how much the revenues of a company will grow given the expected growth rate of the idustry it belongs.
First of all we need to project the industry’s revenues in the future, usually over a time span of 10 years. Is often use in company’s valuation – however not set in stone – to forecast the company’s cash flows for the next 10 years and after that assuming the company will enter its stable growth phase in perpetuity.
To do that the we start by applying the expected growth rate calculated before to the current total revenues of the industry, obtaining the expected industry revenues for the next year, and after that, we let the expected growth rate gradually decline till arrive at a stable growth rate by the 10th year.
The stable growth rate is often referred to as the rate at which the economy will grow in perpetuity, as no company can grow indefinitely at a rate higher than the economy’s without eventually becoming larger than the economy itself. In company valuation, the risk-free rate of the currency in which you are valuing your company is commonly used as the stable growth rate.

Once you have projected the industry revenues, the next step is to determine the market share of the overall industry revenues that the company you are valuing will achieve.
We start by assessing the current market share of our company, dividing the current company revenues by the current industry total revenues. The value obtained shows where the company we’re analysing has positioned itself among all other players in the industry in which it operates, on a revenue basis at least.
Knowing what market share a company has achieved is one of the main building blocks of a good valuation, as it gives investors useful insights on the other two key drivers of value: profitability and efficiency.
A company with a dominant market share surely has higher chances to register better operating margins – higher profitability – and greater economies of scale – better efficiency – than a company with a weak market share. Additionally, observing how the market share of a company has changed over the years – whether it has improved or deteriorated – allows investors to refine their assumptions about the company’s future.
Having said that, the following step is projecting the firm’s market share into the future. By multiplying the total industry future revenues by the expected market share, we obtain the expected future revenues of the company we are analysing.

Projecting the company’s future market share however, is simplier in theory than in practice. Investors tend to forget that the company they’re analysing isn’t the only player. An industry is a complicated amalgamation of many firms each trying to emerge from the mass.
Every action a firm undertakes will be met with a counteraction from one of its competitors. When forecasting companies’ market share is important to always have a clear overview of the effect that an increase or decrease in one firm’s market share will have on the others.
If we assume the company we are analysing will improve its market share, that will happen at the expense of the other companies operating in the market, which will see their market share decline or worse go bankrupt. On the other hand, if we assume the market share will decline, we are impling that other companies will expand their operations and possibly cut out the company we are analysing from the market.

Here it ends our excursus on how to calculate revenue growth rate in a company’s valuation. While there is no guarantee that this approach will yield the exact same revenue growth rate a company will eventually achieve – high are the chances of eventually ending up wrong – it allows investors to come up with a reasonable and plausible expected revenue growth rate which takes into account the industries’ dynamics in which the company operates rather that treating the firm as a standalone actor playing the business game in its own little garden.
Last but not least, if you are interested in trying this approach, you can find the expected growth rate for each of the 37 industries used in the sample on my website. Additionally, the site offers other useful data such as equity risk premiums for 39 different countries—used for calculating discount rates—as well as expected earnings growth rates for those countries based on analysts’ expectations. Detailed industry and sector reports are also available, containing data like total revenues, total free cash flows, median operating margins, return on capital, as well as beta and financial ratios used to assess companies’ risk.